
Published: November 2, 2026 · 9:58 PM IST
Article › Explainers
The Weekly Statistical Supplement is a set of data tables that the Reserve Bank of India (RBI) publishes alongside its Bulletin. The extract released on October 30, 2026 covers RBI’s balance sheet items, foreign exchange reserves, bank deposits and credit, money stock and daily liquidity operations. This explainer shows what each table measures and how a retail reader can read the numbers.
The securities or scheme(s) are quoted as an example and not as a recommendation.
What the supplement is
The supplement is a statistical extract of the RBI Bulletin, issued as a press release (2026-2027/1413). It contains numbers and no commentary. The RBI notes that some data are provisional and that small differences may arise from rounding off.
The extract carries table numbers 1, 2, 4, 6 and 8, so it is a selection and not the complete supplement. Amounts are given in Rs. crore, and foreign exchange reserves are also given in US$ million.
Foreign exchange reserves
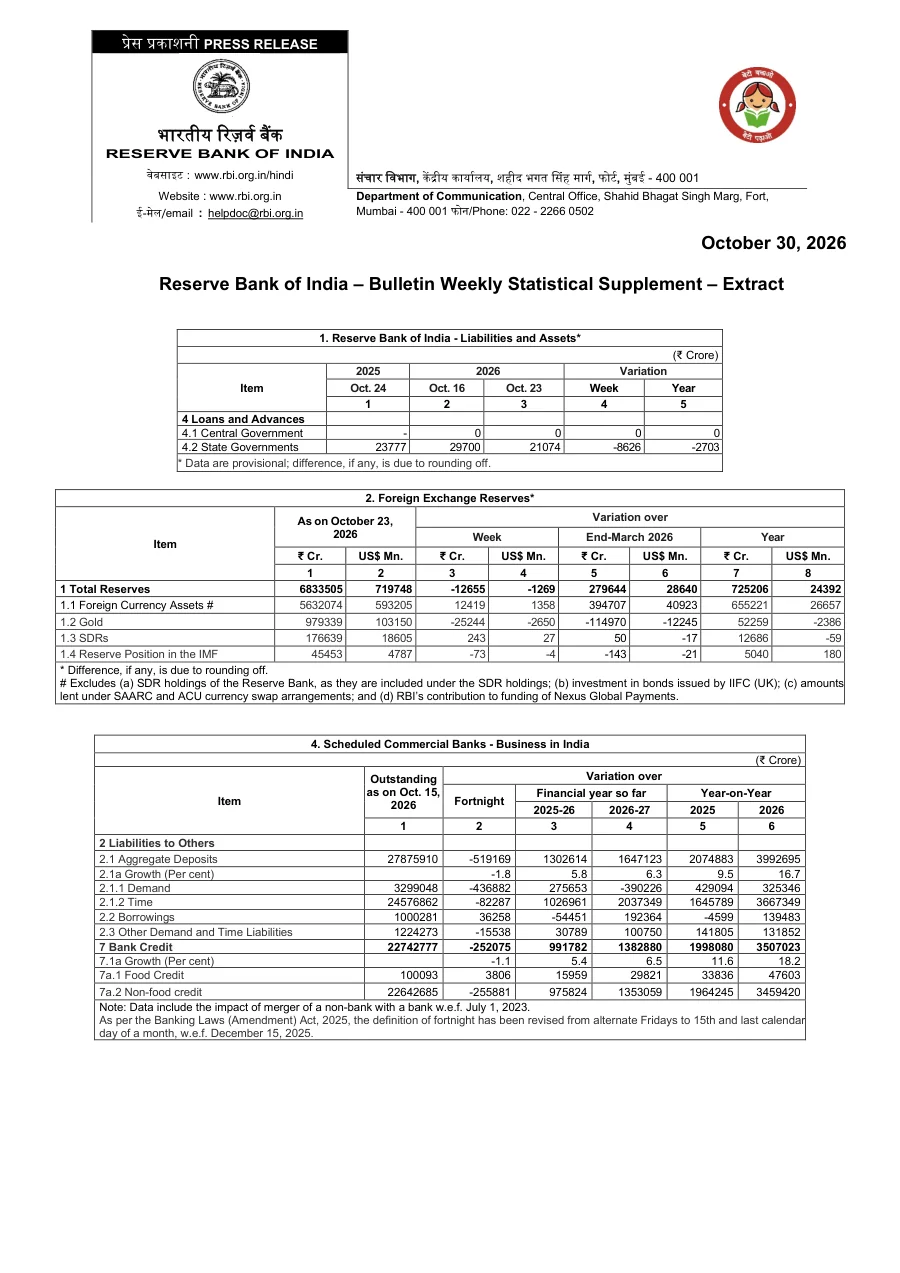
Table 2 shows India’s foreign exchange reserves as on October 23, 2026. Total reserves stood at Rs. 68,33,505 crore, or US$ 719,748 million. The table splits the total into four parts:
- Foreign currency assets: Rs. 56,32,074 crore (US$ 593,205 million).
- Gold: Rs. 9,79,339 crore (US$ 103,150 million).
- SDRs: Rs. 1,76,639 crore (US$ 18,605 million). SDRs are Special Drawing Rights, a reserve asset created by the International Monetary Fund (IMF).
- Reserve position in the IMF: Rs. 45,453 crore (US$ 4,787 million).
The table also shows changes over the week, since the end of March 2026 and over the year. For the latest week, total reserves showed a fall of Rs. 12,655 crore (a fall of US$ 1,269 million). Foreign currency assets rose by Rs. 12,419 crore, while gold showed a fall of Rs. 25,244 crore. A footnote says foreign currency assets leave out items such as SDR holdings, which are counted separately.
Loans to state governments
Table 1 is an extract from the RBI’s liabilities and assets. It shows no loans and advances to the Central Government. Loans and advances to State Governments were Rs. 21,074 crore on October 23, 2026, against Rs. 29,700 crore on October 16, 2026. The weekly variation is a fall of Rs. 8,626 crore, and the yearly variation is a fall of Rs. 2,703 crore.
Bank deposits and credit
Table 4 covers the business of scheduled commercial banks in India as on October 15, 2026.
- Aggregate deposits: Rs. 2,78,75,910 crore. Over the fortnight there was a fall of Rs. 5,19,169 crore, or a fall of 1.8 per cent. Year-on-year (y-o-y), deposits rose by Rs. 39,92,695 crore, or 16.7 per cent.
- Demand and time deposits: demand deposits (money that can be withdrawn at any time) were Rs. 32,99,048 crore, and time deposits (money kept for a fixed period) were Rs. 2,45,76,862 crore.
- Bank credit: Rs. 2,27,42,777 crore. Over the fortnight there was a fall of Rs. 2,52,075 crore, or a fall of 1.1 per cent. Y-o-y, credit rose by Rs. 35,07,023 crore, or 18.2 per cent.
- Food credit and non-food credit: food credit was Rs. 1,00,093 crore, and non-food credit was Rs. 2,26,42,685 crore.
The RBI also notes a change in definition. Under the Banking Laws (Amendment) Act, 2025, a fortnight now means the 15th and the last calendar day of a month, effective December 15, 2025. Earlier it meant alternate Fridays.
Money stock
Table 6 shows M3, a broad measure of the money held by the public. It includes cash with the public and deposits with banks. M3 was Rs. 3,33,00,300 crore on October 15, 2026, against Rs. 3,14,53,126 crore on March 31, 2026. Over the fortnight, measured with respect to September 30, 2026, there was a fall of Rs. 4,69,584 crore, or a fall of 1.4 per cent. Y-o-y, M3 rose by Rs. 45,85,940 crore, or 16.0 per cent.
The table also lists the components of M3 as on October 15, 2026:
- Currency with the public: Rs. 42,55,656 crore.
- Demand deposits with banks: Rs. 34,53,877 crore.
- Time deposits with banks: Rs. 2,54,63,077 crore.
- ‘Other’ deposits with the RBI: Rs. 1,27,690 crore.
On the sources side, net bank credit to government was Rs. 94,54,452 crore. Bank credit to the commercial sector was Rs. 2,36,02,596 crore.
Liquidity operations
Table 8 lists the RBI’s daily liquidity operations from October 19 to October 25, 2026. Liquidity here means the cash available in the banking system. The table includes the Liquidity Adjustment Facility (repo, reverse repo, variable rate repo and variable rate reverse repo), the Marginal Standing Facility (MSF), the Standing Deposit Facility (SDF) and outright open market operations (OMO).
The last column gives the net result for each day. It shows either a net injection of money into the system or a net absorption. All seven days show a net absorption. The net absorption was Rs. 86,036 crore on October 19, Rs. 1,19,657 crore on October 23 and Rs. 1,71,858 crore on October 25.
Things to check when reading the tables
- Look at the units. Some columns are in Rs. crore and others in US$ million.
- Note the date or fortnight of each table. They do not all cover the same dates.
- Check the direction of change. A minus sign in the source shows a fall or, in the liquidity table, a net absorption.
- Read the footnotes. They explain what is excluded and how dates are defined.
- Remember that provisional data can be revised later.
Official source document
Published by Reserve Bank of India, Press Release 2026-2027/1413.
Sources
Related on FinvestNews
Useful Websites for Investors
- BSE Ltd.: https://www.bseindia.com/
- National Stock Exchange of India Ltd.: https://www.nseindia.com/
- Securities and Exchange Board of India: https://www.sebi.gov.in/
Important Disclaimer: News and Education Only, Not Investment Advice
FinvestNews is a news and educational publication. It is not a SEBI registered Investment Adviser or Research Analyst. This page is not investment advice, not a research report, not a recommendation and not an invitation to buy, sell or hold any security.
Investments in securities market are subject to market risks. Read all the related documents carefully before investing. Past performance is not indicative of future results, and nothing here is a guarantee of returns.
This article reports information from the sources named on this page. You are solely responsible for your own decisions; please consult a SEBI registered Investment Adviser before investing.
The author(s) may or may not hold positions in securities mentioned on this website. FinvestNews does not accept payment, sponsorship or commission for any article, and has no business relationship with the companies named unless stated on the page.
No sign-in and no comments. Your choices stay in this browser. The heart saves this topic.